Project stage: Completed
- Tran, C., & Zakariyya, N. (2021). Tax Progressivity in Australia: Facts, Measurements and Estimates. The Economic Record, 97(316), 45-77.
- Public engagement: Tax progressivity in Australia: things aren’t as simple as they seem, Austaxpolicy: Tax and Transfer Policy Blog, 28 March 2019.
- Research mention in the news: ‘Don’t trust pollies to tell you the truth about tax’, by Ross Gittins. Sydney Morning Herald. 11th May 2019.
This is an empirical examination of trends in the progressivity and redistributive effect of income tax in Australia since the introduction of A New Tax System (Goods and Services Tax) Act 1999. We employ two methodological approaches: one based on tax liability progression and one based on tax liability distribution, and estimate trends in income tax statistics between 2000 and 2018 using administrative tax data from the ATO and panel data from HILDA.
Key findings:
Between 2000 and 2018, income tax in Australia went through cycles of lesser and greater progressivity.

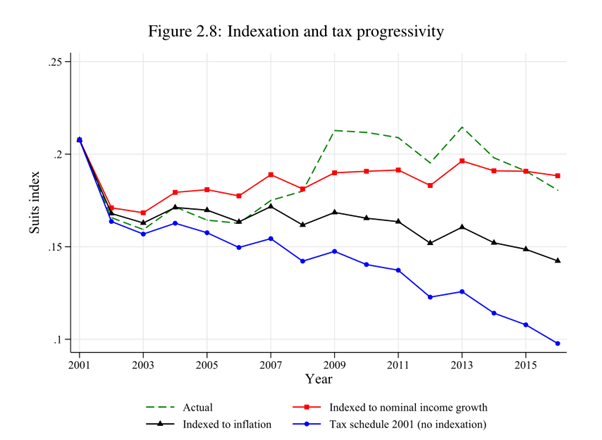
We identify two main drivers of the tax progressivity cycle: lack of automatic indexation and mismatch between the income tax code and the evolution of market income distribution. Active tax policy with frequent adjustments to income brackets, marginal rates and offset levels drive the progressivity level before 2010. Meanwhile, inactive tax policy induces lower levels of tax progressivity after 2010 as the income tax code fails to track the changes in market income distribution. Indexation to inflation can partially mitigate the decline in progressivity; however, it is not a full substitute for a proper tax indexation system with (annual) frequent adjustments.